FOX HOT AIRBeta
Free forever for every balloon pilot

Every weather model. One balloon briefing.

Stop reading four apps and guessing which to trust. Fox Hot Air blends every forecast model, finds your launch and landing sites, checks airspace and TFRs and shows the winds you're actually flying in.

Create your free account Sign in

Free forever. Works on iPhone and Android: add it to your home screen, no App Store needed.

Now in beta. Fly with it, and tell us what to improve from the Feedback tab in the app. We read every message.

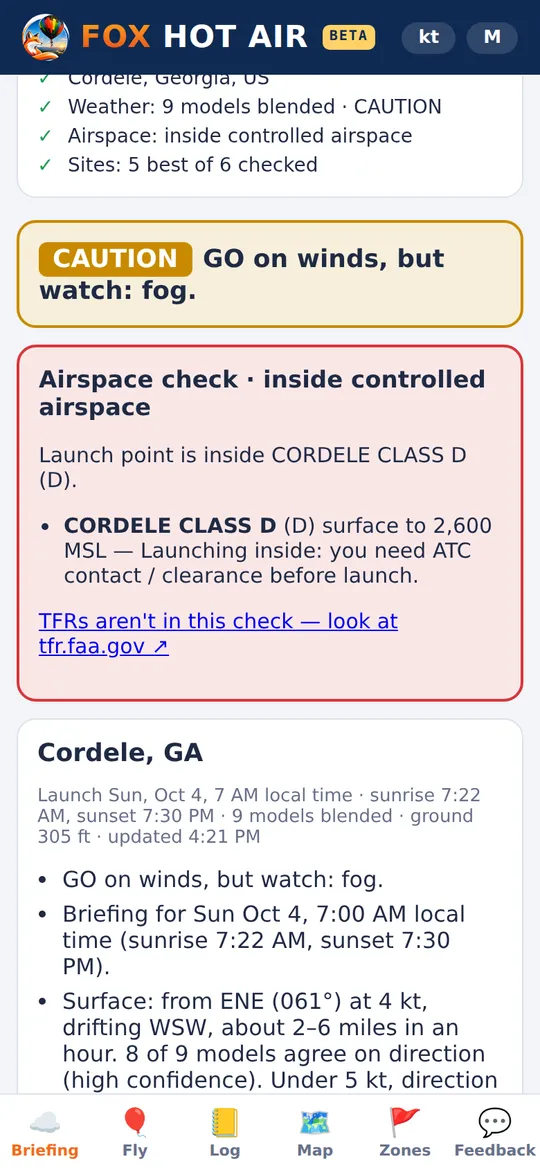
Fox Hot Air briefing: CAUTION, GO on winds but watch fog, the time the weather was pulled, the FAA airspace check and nearby TFRs on a map

One model pointed the wrong way. The blend didn't.

Below about 5 knots, weather models routinely disagree on direction. Before a sunrise flight in Cordele, Georgia, the most popular short-range model had the surface wind wrong. Blending every model caught it.

HRRR aloneSurface wind from the SE. Drift toward the NW, over town.
Fox Hot Air blend8 of 11 models said NE–E. Drift SW–W, over open farmland.
At launchNorth wind. The balloon went south over open country, just as the blend said.
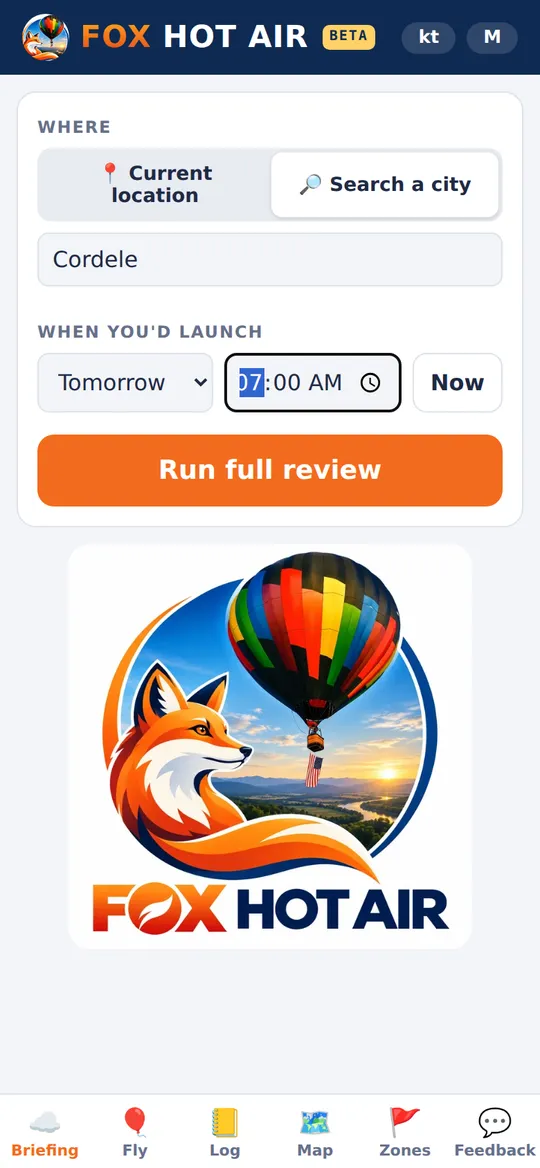
Run full review: current location or search a city, pick the day and time, one button
One button

Where, when, go.

Use your location or type any town. It's already set to tomorrow's sunrise; pick another day or time, up to five days out, and tap Run full review.

The answer comes first: GO CAUTION NO-GO, then a few plain lines: surface wind and where you'll drift, the winds higher up, fog and when thermals start. Not sure about something? Ask about it right there on the briefing.

  • Always the latest weather. Every review pulls every model fresh, right then. Nothing is reused from earlier.
  • You can see how fresh it is. Every briefing says "Weather updated" with the exact local time and how many minutes ago.
  • Old briefings warn you. After an hour, or once the launch time has passed, it says OLD BRIEFING in red until you run it again.
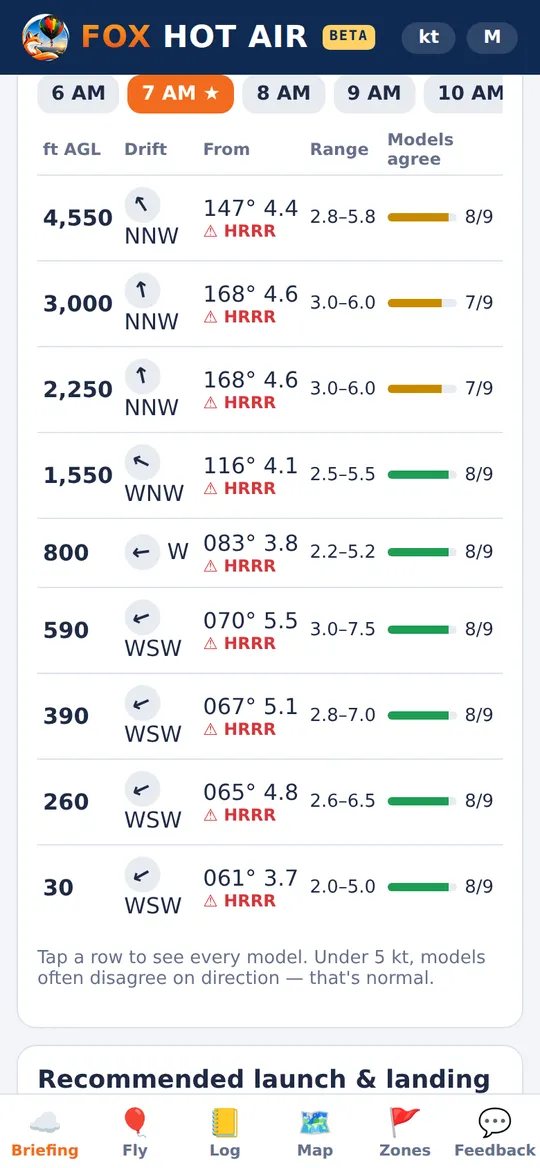
Winds aloft table: every 100 ft up to 1,000 ft, then by the thousand, with drift arrows and how many models agree
Winds aloft

Every altitude on one screen, every model behind it.

HRRR, NBM, GFS, ICON, ECMWF, GEM, the UK Met Office, Météo-France, JMA and more, blended the right way, with vector math, never by averaging directions.

  • Every 100 ft from the surface to 1,000 ft, where you fly most, then 2,000, 3,000, 4,000 and 5,000 ft.
  • Hour by hour, with drift arrows, the range of speeds and how many models agree. Tap a row to see every model.
  • Heights are measured from the ground you launch from, so a mile-high field like Albuquerque gets the same full table as a field at sea level.
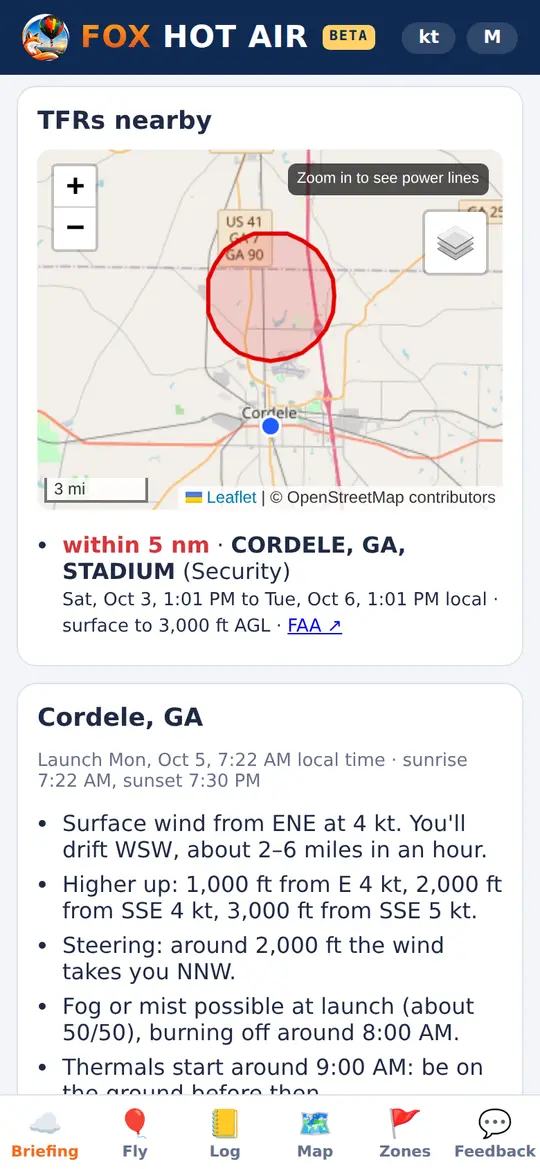
TFRs nearby: a map with the TFR in red near the launch point, and its name, local times and altitudes
TFRs

Every TFR checked, automatically.

Each briefing reads the FAA's live list of Temporary Flight Restrictions and checks them for your launch time.

  • On a map, in red, with your launch point.
  • In plain words: the name, the times in your local time, and the altitudes. Nothing else to decode.
  • Flagged when it matters: any TFR over your launch, on your forecast drift, or within 5 nm stands out in red.
  • Daily hours read right: event TFRs that are only active certain hours each day, like a festival's morning session, only count when they're active.
  • If the FAA list can't be read, the briefing says so. It never says "no TFRs" unless it checked.
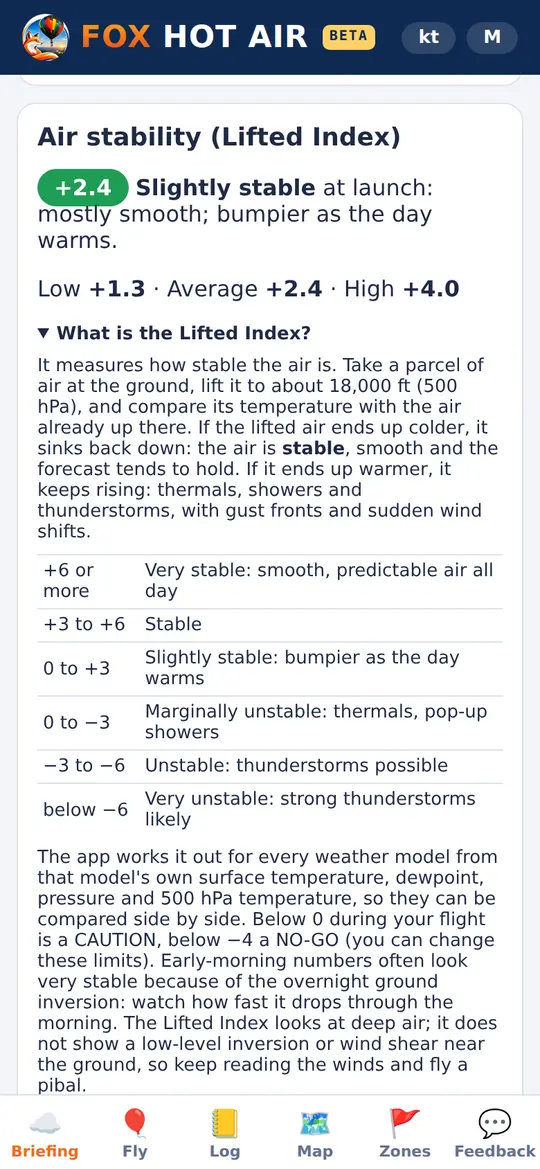
Air stability card: the Lifted Index at launch with low, average and high across the models
Air stability

Will the air stay smooth?

The Lifted Index tells you how stable the air is: smooth and predictable, or ready to build thermals and pop-up storms. Fox Hot Air works it out the same way for every model and shows you just three numbers: low, average and high, with what that means for your flight.

If the air turns unstable during your flight, the briefing goes to CAUTION, or NO-GO when it's strongly unstable.

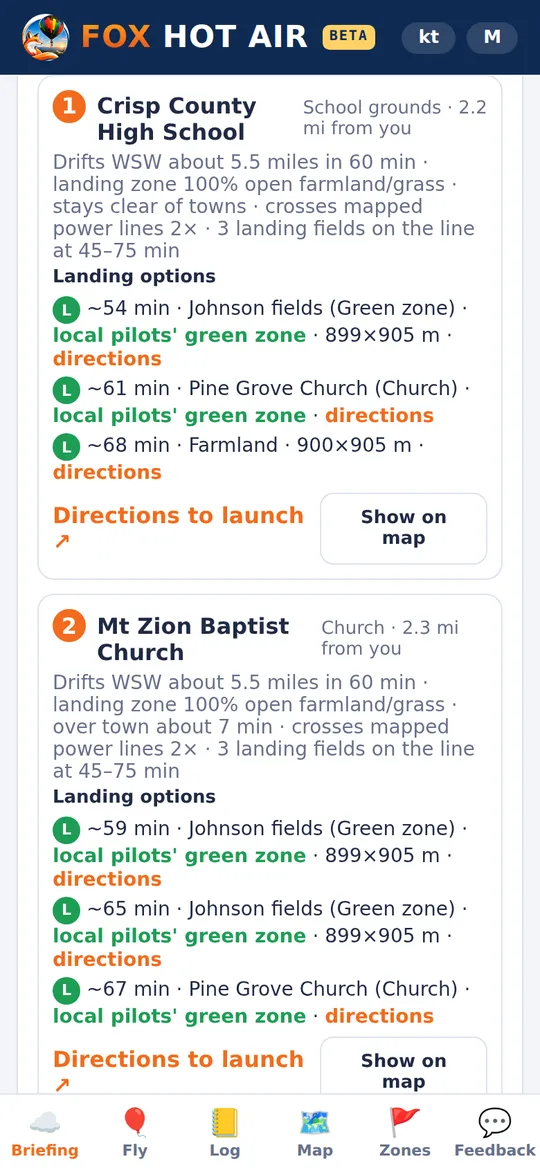
Recommended launch site with landing options in a local pilots' green zone and at a church
Launch & landing sites

Where to launch, and where you'll come down.

  • Every park, sports field, school, church and small airfield nearby gets a simulated flight on the blended winds.
  • Ranked by what lies downwind: towns, water, power lines, airports, controlled airspace and active TFRs count against a site.
  • Each site gets a short summary in plain words: where you'll drift, how much open land there is, and what to watch for.
  • Landing fields on the drift line at 45 to 75 minutes, with local pilots' green zones and churches first, and nothing inside a red zone.
  • Directions to every launch and landing spot for you and your chase crew.
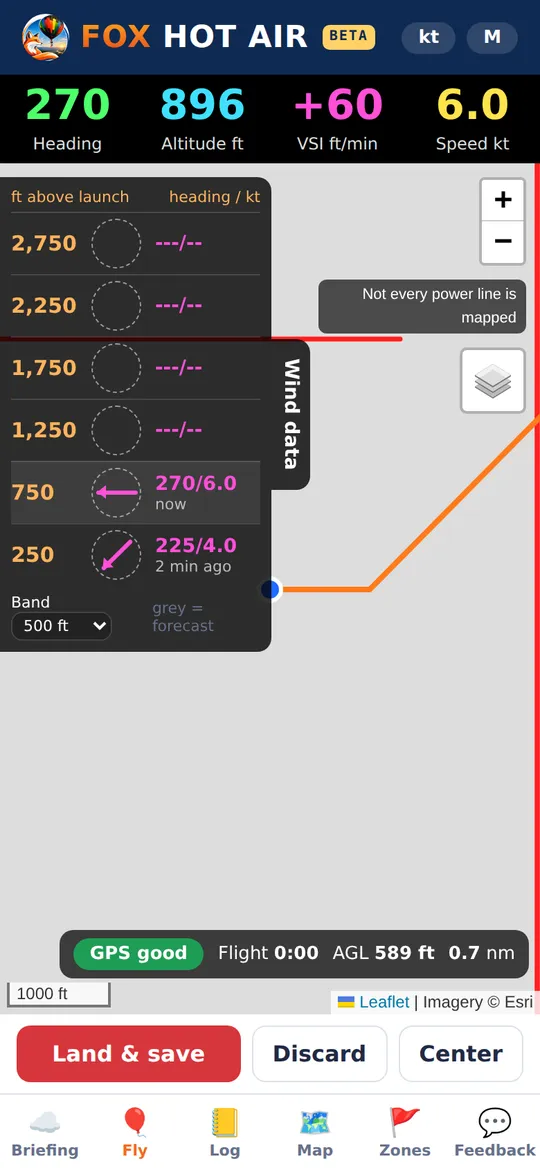
Real-time screen with heading, altitude, climb rate, speed and measured winds by altitude band
In flight

Your balloon measures the winds aloft.

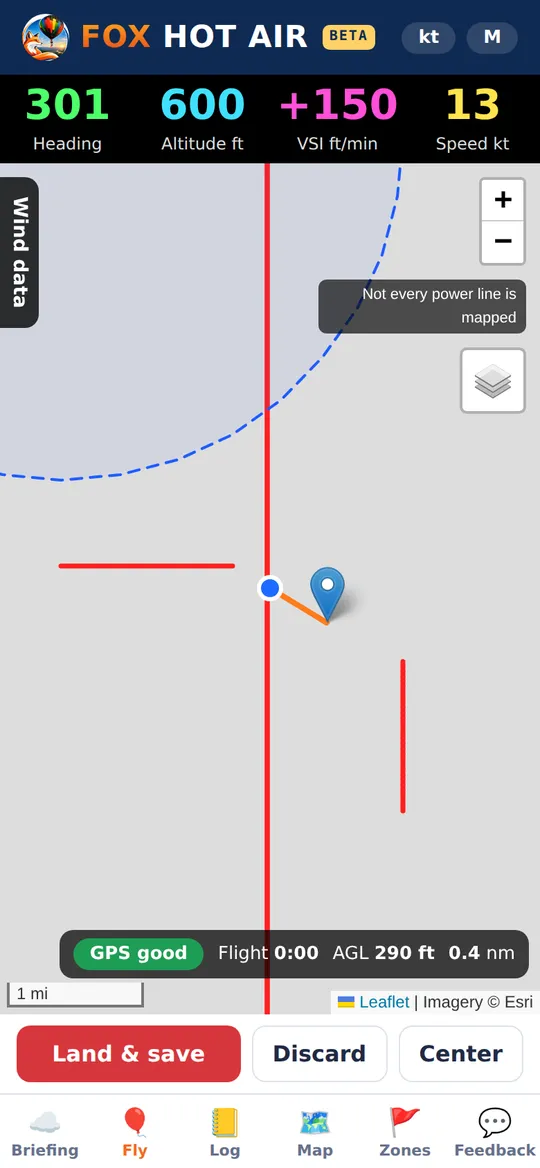
Tap Fly and tracking starts: heading, altitude, climb rate and speed. Your balloon moves with the air, so your track is the wind. The Wind data panel shows heading and speed at every altitude band you've flown through, with the forecast beside it, so you know where the turn is when you want to steer. Power lines show in red on the map.

Fly screen with power lines drawn as solid red lines on the map
Power lines

Every power line we can find, in solid red.

Power lines are the most dangerous thing in ballooning, so every map in Fox Hot Air draws them as one solid red line, wherever you are in the US.

  • Where they come from: OpenStreetMap's power network, the transmission and distribution lines that utilities and volunteers have mapped.
  • Filling the gaps: where only the poles are on the map, Fox Hot Air joins neighboring poles (less than about 300 ft apart) into a line, because that's how lines run along roads.
  • On the map, not in your face: no alarms or pop-ups. Almost every road has a line, and constant warnings would only distract you while you fly.
  • Ready in the air: lines load for the area around you and are kept on your phone, so they stay on the map if your signal drops.

Not every power line is mapped. There's no public national database of power poles, so treat the red lines as a help, not a guarantee, and always look.

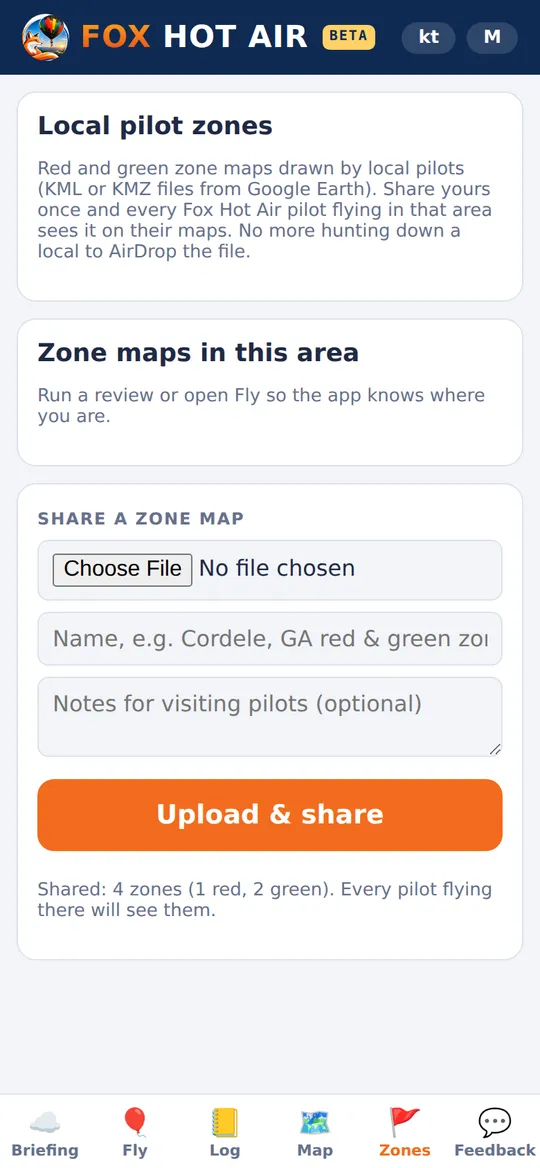
Zones tab with a local pilot's red and green zone map shared with every pilot
Local pilot zones

No more hunting for a local to AirDrop the map.

Local pilots share their red and green landing zones once, straight from Google Earth (KML or KMZ). Every Fox Hot Air pilot flying in that area sees them on their maps automatically, with the notes that matter: "No landing, livestock." "Gate code on the post." As pilots add their areas, it covers the whole country.

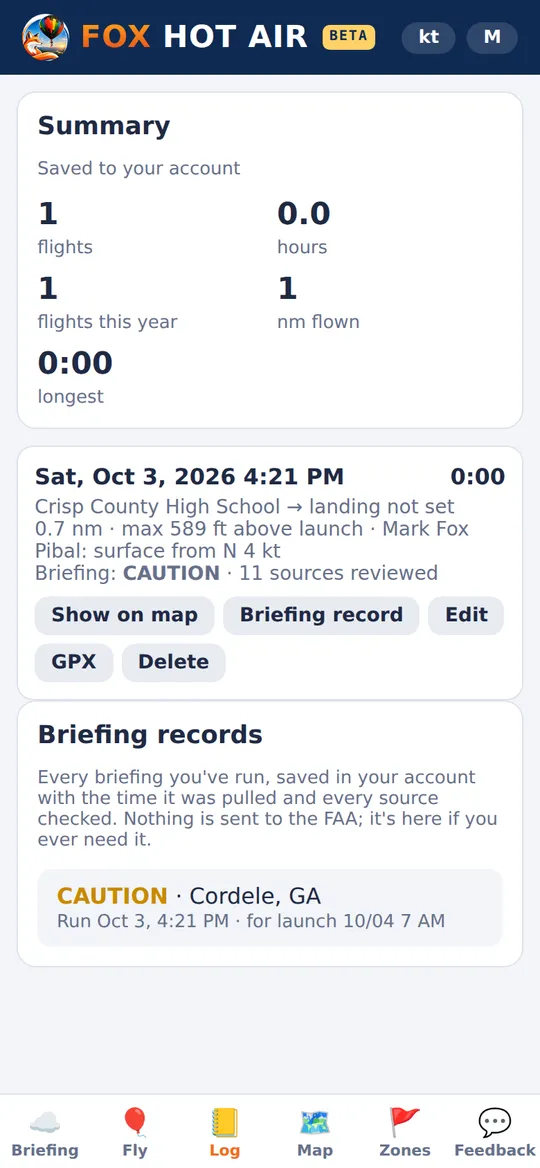
Flight log with a saved flight and the list of saved briefing records
Log & briefing records

Every flight, and proof of every briefing.

Flights are saved to your account with your track, pibal, notes and the winds you measured. Every briefing is saved with the time it was pulled and every source it checked, including the airspace and TFR checks, so a record that you reviewed all available weather information is there if you ever need it. Nothing is sent to the FAA.

Free forever. Up and flying in two minutes.

Fox Hot Air is a web app. It installs from your browser, so there's nothing to download from an app store.

  1. Create your free accountHere at foxhotair.com: your name, email and a password. No card, no trial, no catch.
  2. Add it to your home screenThe app shows you how: on iPhone, Share then Add to Home Screen; on Android, one tap.
  3. Tap the foxIt opens straight to your account, signed in, with your flights and briefings. New features arrive on their own: no updates to install.

Made by balloon pilots who were tired of guessing which forecast to trust.

Built by a Rocket Scientist and Claude.